
App Operation Guide
This guide explains how to use TradeSimuFx: Forex Trading Simulator. Screen and button names are written as they appear when the app is displayed in English.
Open Settings from the menu button (≡) at the top right of the chart screen on iPhone, or from the gear button on the chart screen on iPad.
- Indicator, Appearance and Initial Capital Settings
- Choosing a Date and Playing the Chart
- Drawing Trendlines and Horizontal Lines
- Placing Orders
- Reviewing Trade Results
- Useful Tips
1. Indicator, Appearance and Initial Capital Settings
Indicator Settings
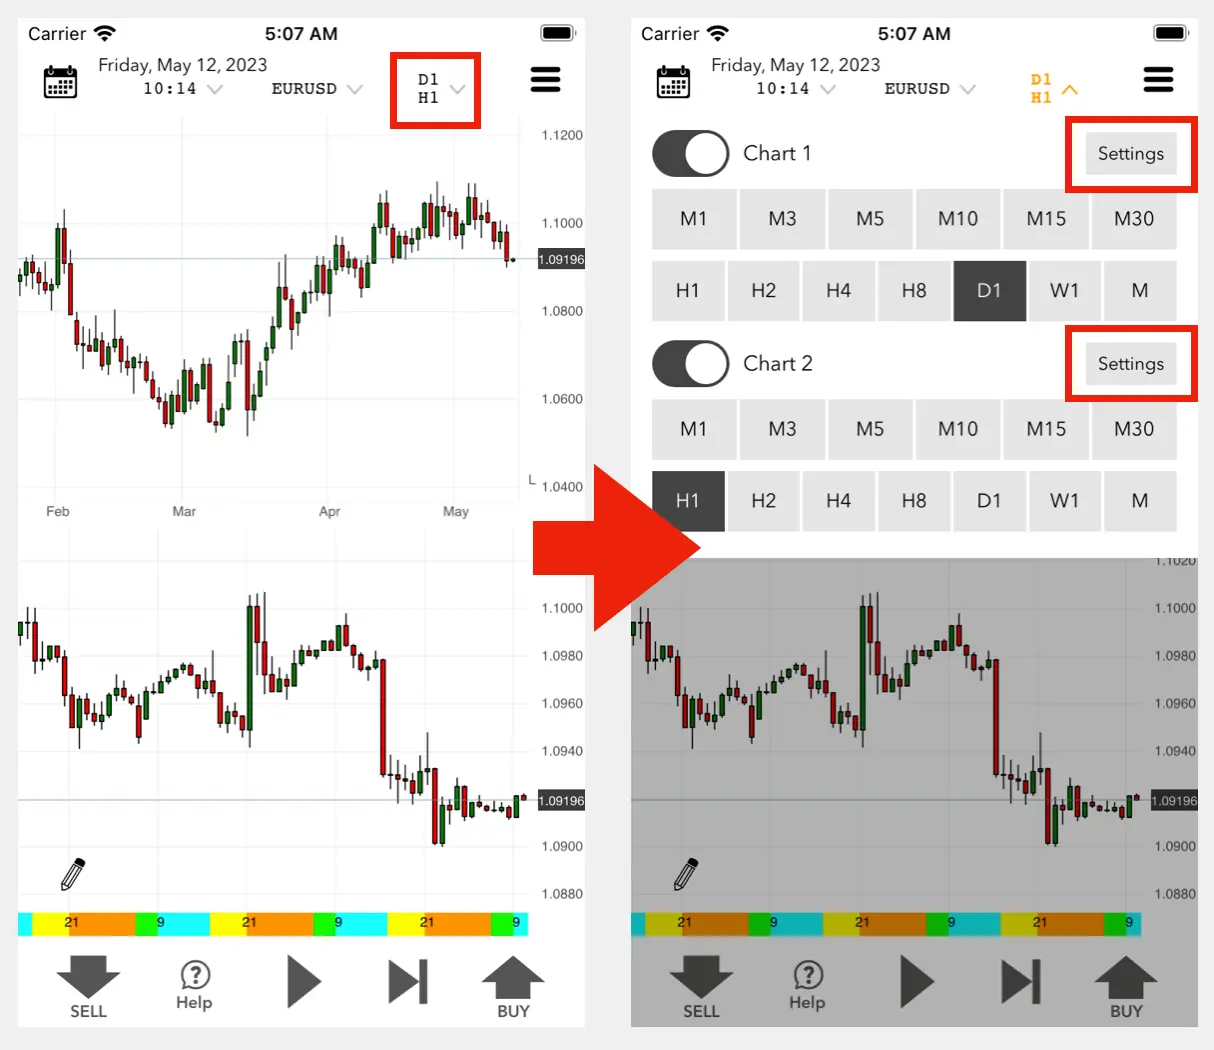
- Tap the time frame display in the chart screen header (for example, "H4 / H1").
- Tap Settings next to "Chart 1" or "Chart 2" to open the indicator settings for that chart.
You can also open them from Settings → Indicator Settings → "Chart 1", "Chart 2" or "Chart 3" ("Chart 4" is available on iPad).
Main settings on this screen:
- Chart type: Candles, Heikin Ashi, Line, Bars or Hide
- Indicators (Main window) and Indicators (Sub window): Moving Average and other indicators
- Tick Volume
- Trade History: markers for your entries and exits
- Bookmark
- Economic Events
- Grid: Auto or Manual, and Round Number lines
- Show date separators: shown as a vertical line or as a high/low box
- Range of charts to load
Session-related displays such as "Asian High/Low Box" and "Color the time axis for each session" are also on this screen.
Chart Appearance (Colors)
Go to Settings → Chart Appearance to change "Color Themes", the background color, candlestick colors, "Candlestick Width" and "Candlestick Border Width" (Wide / Normal / Narrow), and the "Color and Shape of the Entry Marker".
Initial Capital
Setting an initial capital is optional. Without it, results start from 0.
The initial capital is set for each data sheet:
- When you create a data sheet, enter it in "Initial Capital".
- To change it later, open the data sheet details and tap the top row (the data sheet name), then enter "Initial capital".
Settings → Initial Funds & Lot → "Initial Funds Settings" also shows where to set it.
When an initial capital is set:
- The data sheet list and the data sheet details show the balance including the initial capital.
- For the risk of ruin, "Risk Amt Per Trade (%)" is set automatically from the maximum loss divided by the initial capital. If it cannot be calculated (no initial capital, no losing trades, or no trades), 2% is used.
- Fixed Risk mode can be used (see Fixed Risk Mode).
Lot Size and Currency
Go to Settings → Initial Funds & Lot → "1 Lot Size" to choose how many units one lot represents: 1,000, 10,000 or 100,000 units for FX pairs, and 1, 10 or 100 oz for XAUUSD. The default is 100,000 units. Check the contract size used by your broker (often 100,000 units in MT4 and MT5).
"Currency ($/¥)" on the same screen selects the currency used for amounts.
2. Choosing a Date and Playing the Chart
Jumping to a Date
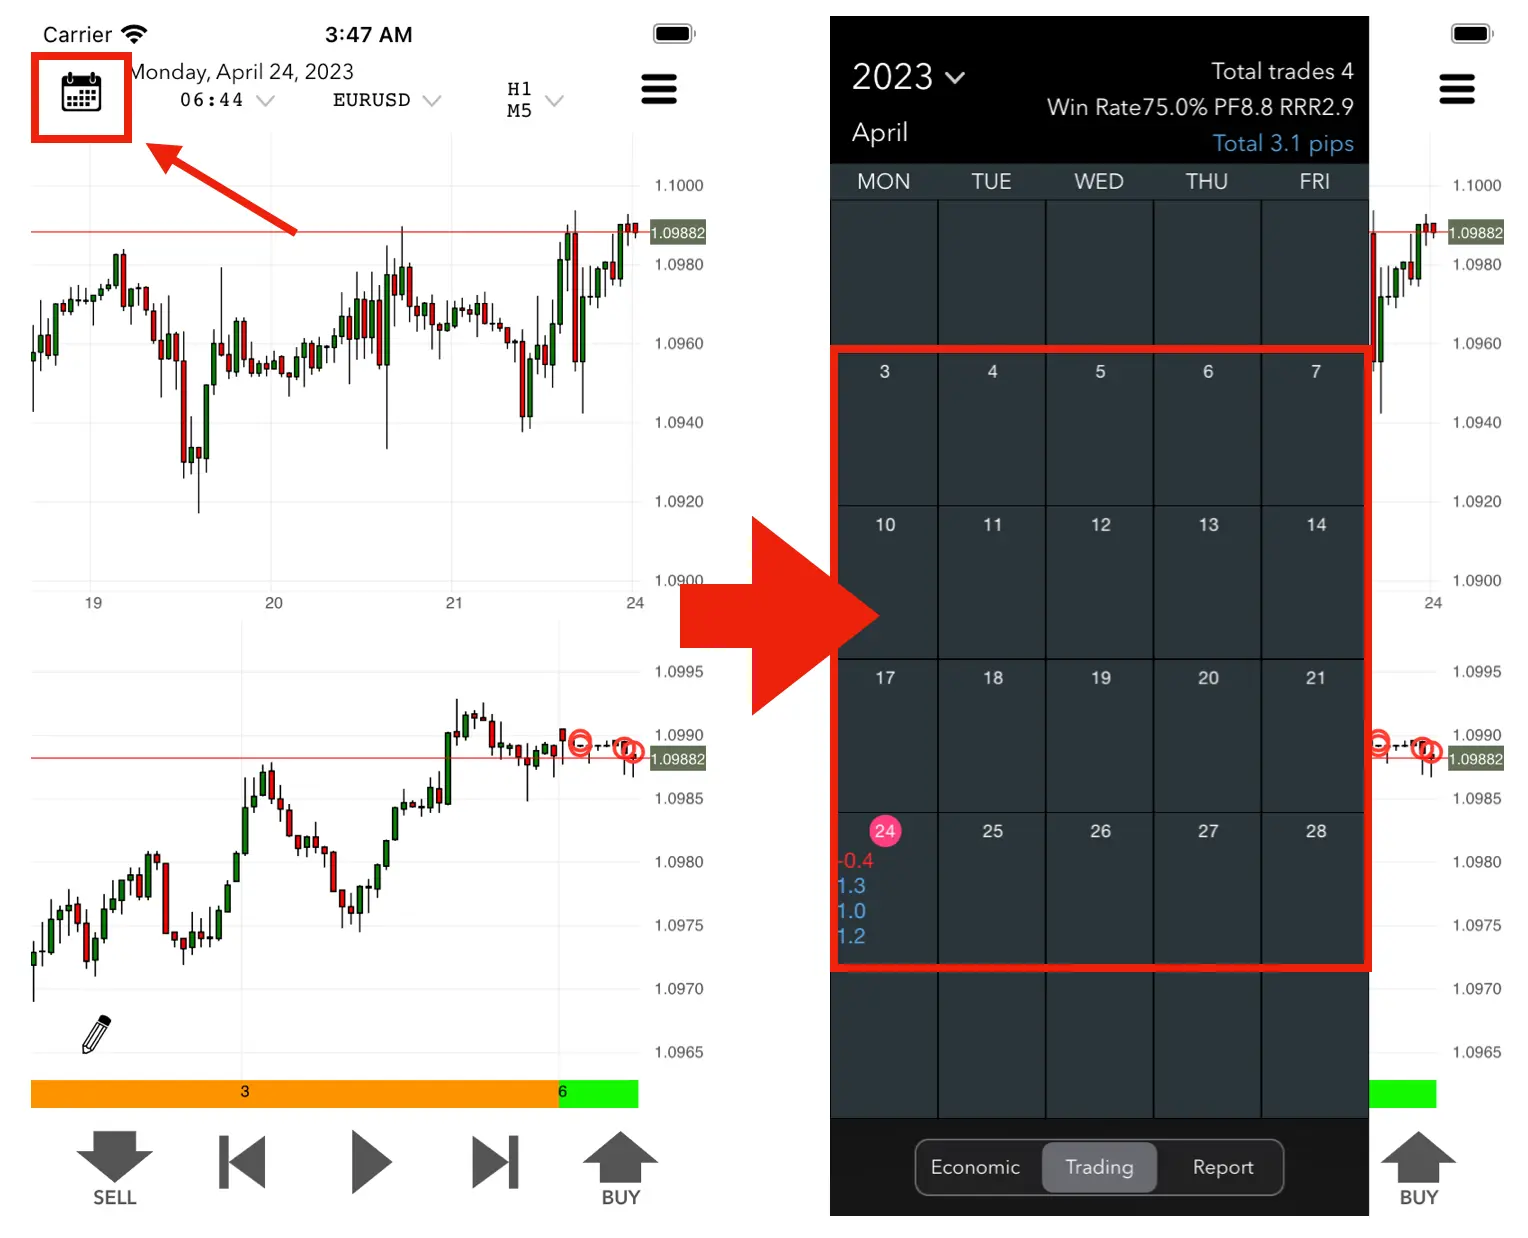
- On iPhone, tap the calendar button at the top left (or swipe right from the left edge of the chart). On iPad, tap the date display.
- Tap a date on the calendar to move the chart to that date.
- Scroll up and down to change the month.
- Weekends are not shown on the calendar.
- What happens when you tap a date can be changed in Settings → Calendar Behavior → "When tapping the calendar date".
Playback Speed and Playback Unit
Tap the time in the chart screen header (for example, "11:44") to open the playback menu:
- Speed and Update times per second: how fast the chart plays
- Player Timeframe: the playback unit (1min, 5min, 15min, 30min, 1h or 4h)
- Speed of forward button: ×1, ×2, ×4 or ×8
- Pick Random Date
Related settings are in Settings → Playback Behavior, such as "Keep playback unit whenever possible" and "Automatically adjust playback unit to timeframe".
Chart Menu
Double-tap the chart to show a menu for the chart:
- The time frame and the chart type with the number of bars on the screen (tap the chart type icon to open the indicator settings)
- The template name (tap to switch templates; see Templates)
- Camera (save the chart image) and bookmark
- The date and time of the candle you tapped (tap to move to that time)
In Settings → Chart Operation → "Chart", you can choose whether the menu opens with a double tap or a single tap, and what it shows ("Basic Menu", "TimeFrame", "Play" or "Forward Button").
Changing the Time Frame
Tap the time frame display in the header and choose a time frame for each chart (from M1 to the monthly chart "M"). On iPhone in portrait, you can turn on "Chart 3" to show up to three charts.
On iPhone in landscape, one chart is shown at a time. Tap the "Chart1" / "Chart2" button at the bottom right to switch charts instantly, or long-press it to change the time frame.
In Settings → Chart Operation:
- "iPhone Landscape left menu" moves the buy/sell buttons to the left.
- "Reduce the size of the buy/sell buttons" makes them smaller when you have no position and shows chart1/chart2 switching buttons at the bottom left.
- "Button to change time frame" adds buttons at the lower left that change the time frame one step at a time.
Back and Forward Buttons
The forward button moves the chart ahead by one candle of the smallest time frame on the screen. The back button moves it back.
With some combinations of time frames (for example, when a weekly or monthly chart is shown together with a short time frame), the buttons move by the playback unit and the chart is reloaded.
In Settings → Playback Behavior:
- "Set forward button to match playback unit" makes the forward button always move by the playback unit.
- "Do not always display the back button" hides the back button.
3. Drawing Trendlines and Horizontal Lines
Drawing Tools
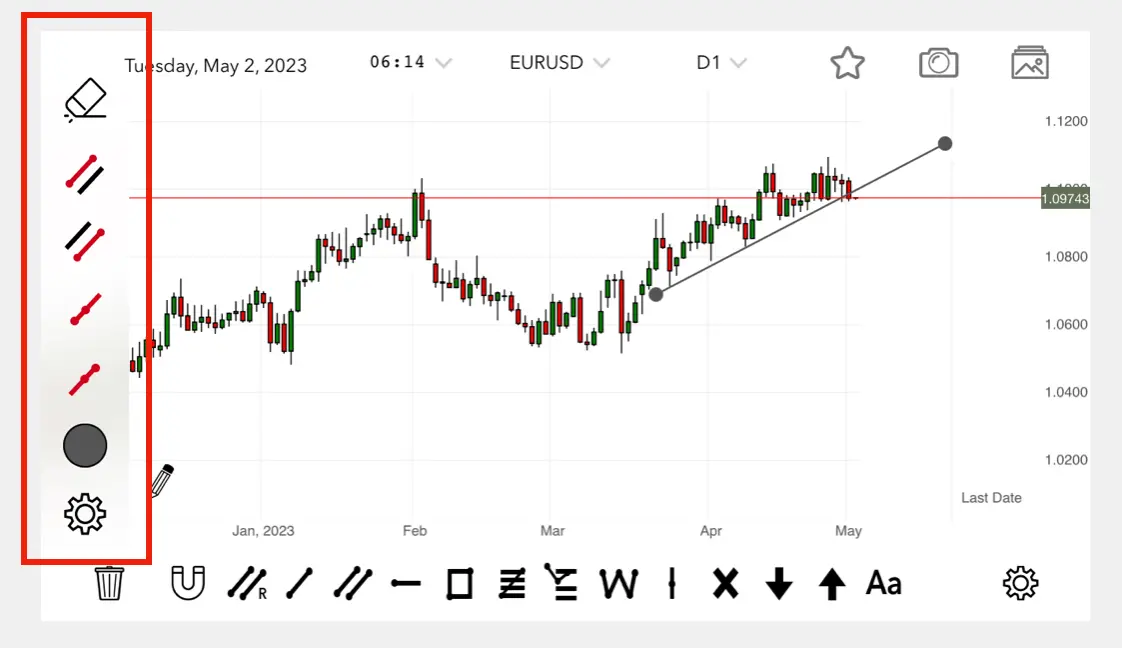
- Tap the pencil button at the bottom left of the chart to enter drawing mode. Playback pauses while you draw.
- Choose a tool from the toolbar, such as "Trendlines", "Channels", "Horizontal Ray", "Box", "Fibonacci Retracement", "Polyline", "Vertical line", "Text" or "Freehand".
- Draw on the chart. When a shape is selected, its menu (color, delete and so on) appears.
- To finish, tap the pencil button again, or tap play, forward, back, BUY or SELL.
- To edit a shape later, double-tap it on the chart.
- To draw a polyline, keep drawing from the end point of the previous segment. Choose "Polyline" again or tap the pencil button to finish.
- Choose which tools appear in the toolbar in Settings → Drawing Tool Settings → "Drawing tools to be displayed in menu".
- On iPhone, "Place Pencil Button at Bottom Right" moves the pencil button. On iPad, "Show Toolbar on Chart" and "Toolbar Layout" (Vertical / Horizontal) change where the toolbar is shown.
Horizontal Lines
- Long-press the price axis at the right edge of the chart to create a horizontal line. Keep your finger down and move it up or down to set the price.
- To move a line later, swipe its price label at the right edge up or down.
- Tap the price label to show the line's menu, where you can place a limit order (see Limit Orders) or turn on "Pause".
4. Placing Orders
Order Modes
Choose the mode in Settings → Order Settings → "Mode":
- Simple: positions in one direction at a time, with one stop and one take profit
- Fixed Risk: the lot size is calculated from the risk (see Fixed Risk Mode)
- Hedging: hold several buy and sell positions, each with its own stop and take profit
Market Orders
Tap BUY or SELL to enter at the current price.
- The lot size for each tap is set in Settings → Order Settings → "Order Unit for Buy/Sell Buttons" (default 1.0).
- With "Buy/sell buttons add lots during pause" turned on (default), tapping the same button several times while playback is paused adds lots to one trade. For example, five taps make one trade of 5 lots.
- "Lot Entry Method" can be changed to "Manual Input" to type the lot size after tapping.
Stop and Take Profit
iPhone in portrait: after you enter, long-press the same button (BUY after buying) to show the list of positions. Check "Stop Order" to add a stop line, or "Limit Order" to add a take profit line.
iPhone in landscape and iPad: after you enter, a small button appears next to BUY / SELL. Tap it to show the same list.
- To move the stop, swipe the price label at the right end of the stop line up or down.
- The lines show "SL", "TP" and the risk-reward ratio ("RR").
- To place a stop automatically when you enter, turn on Settings → Order Settings → "Set up a stop order when placing an order". A trailing stop can also be enabled there.
- In Hedging mode, long-press a position line on the chart to use "Add SL" and "Add TP".
Closing Positions
- In Simple mode, the opposite button changes to Close All while you have a position. Tap it to close everything. Long-press it to set "Limit Order", "Stop Order" or "Trail".
- In the list of positions, swipe a row to the left to show "Close Position" and "Partially" (partial close is available for 0.02 lots or more).
- In Hedging mode, "Close All" is at the top of the list, and long-pressing a position line shows "Close Position" and "Partial Close".
Limit Orders
- Create a horizontal line at the price you want (long-press the price axis).
- Tap the price label at the right end of the line.
- Choose Buy or Sell and the lot size to place the order.
- The order is filled when the price reaches the line. To cancel it, tap the price label and choose "Cancel Order".
- In Simple mode, only one limit order can be placed. Use Hedging mode to place more.
Crosshair
- Long-press the chart to show the crosshair. Drag to move it, or swipe along the time axis or the price axis.
- Tap the price label of the crosshair to show a menu where you can show the risk-reward ("Risk Reward") and place an order ("Sell" / "Buy", lot size, "Order").
- Double-tap the time axis to remove the crosshair.
- Display options are in Settings → Drawing Tool Settings → "Settings for crosshair lines".
Fixed Risk Mode (Automatic Lot Size)
In Fixed Risk mode, the lot size is calculated so that a loss at the stop equals a fixed percentage of your balance (or of the initial capital, if "Always calculate risk based on initial capital" is turned on). When you move the stop, the lot size changes automatically.
Example: with a stop at 3 pips you can enter 10 lots. If you widen the stop to 30 pips, the lot size becomes 1 lot, so the loss at the stop stays about the same (3 pips × 10 lots = 30 pips × 1 lot).
- Turn it on in Settings → Order Settings → "Mode" → "Fixed Risk", and set "Risk (%)".
- An initial capital is required: at least $1,000 (or ¥100,000). See Initial Capital.
- Only one position can be held at a time. Close it before the next entry.
- After you enter and playback moves on, the stop cannot be moved to increase the loss.
- The smallest lot size is 0.01, so the stop cannot be widened beyond that.
Entry Markers
When you enter or exit, markers are shown on the chart.
- To hide them, turn off Settings → Indicator Settings → "Chart 1" (or another chart) → "Trade History".
- Tap the row below the switch to choose the time frames that show markers, the marker shape and colors, and "Connect entry to exit with a line".
- Colors and shapes can also be set in Settings → Chart Appearance → "Color and Shape of the Entry Marker".
5. Reviewing Trade Results
Data Sheets
On iPhone, tap the menu button (≡) at the top right of the chart screen and choose Detail. On iPad, open the data sheet menu on the chart screen and choose Detail. The data sheet list opens; tap a data sheet to see its details.
The details screen has five tabs at the bottom:
- Summary: statistics and graphs. The buttons at the top switch between "Summary", "Duration", "Weekday", "Time", "Date" and "Month".
- Yearly: results by year and currency pair ("By Currency Pair and Yearly", "Yearly" or "By Currency Pair")
- History (iPad: Trading History): the list of trades
- Marks (iPad: Bookmark): bookmarks, comments and saved chart images
- Amount: amounts calculated from pips
The "…" button at the top right shows "CSV export and input", "Export in PDF format" (on the Summary tab), "Backup and Restore" and "Delete the data".
You can switch between data sheets 1 to 5 from the same menu (≡) on iPhone, or from the data sheet menu on iPad.
Reviewing a Trade on the Calendar
- Open the calendar and tap a date to show the trades of that day.
- Tap a trade to show its menu: "Edit Note", "Before entry", "Move after exit" and "Delete".
"Before entry" and "Move after exit" move the chart to the time just before the entry or just after the exit.
Exporting Trade History to CSV
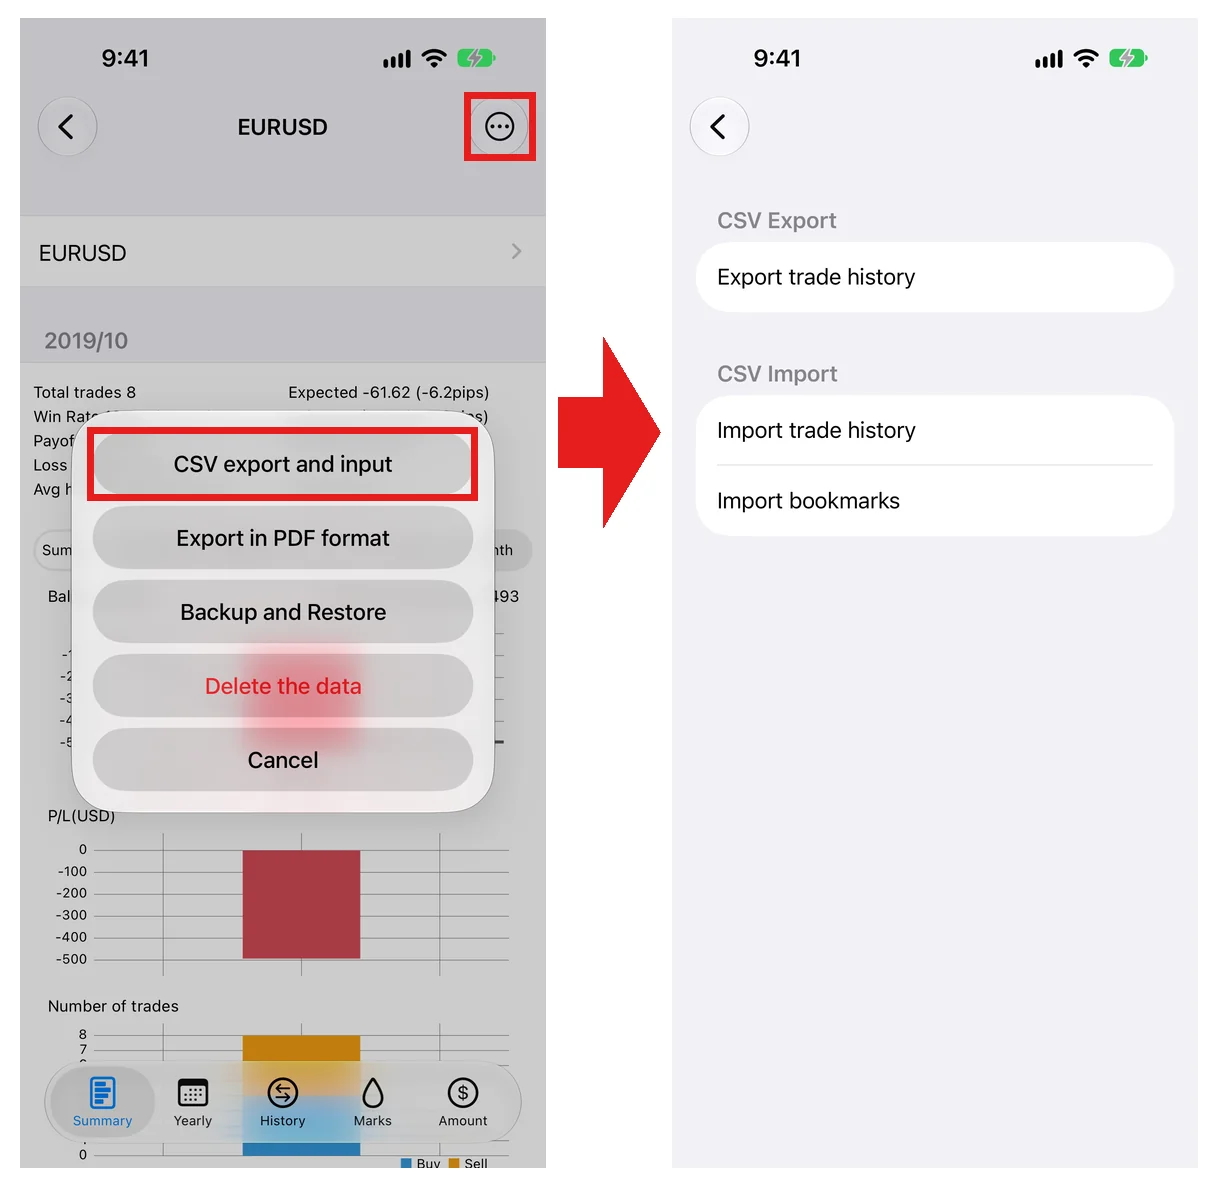
- Open the data sheet details and tap "…" at the top right.
- Choose "CSV export and input", then "Export trade history".
A ZIP file is created that contains the trade history CSV and the bookmark CSV (a file is left out when it has no data). "Import trade history" and "Import bookmarks" on the same screen read CSV files back.
6. Useful Tips
Templates
A template saves a set of indicator settings, for example "Moving Average 75 + RSI" in one template and "Bollinger Bands" in another, so you can switch settings for each trading strategy.
- To switch templates, double-tap the chart and tap the template name in the menu. The first three templates are shown there.
- You can have up to 12 templates. Add, sort, rename, duplicate and delete them in Settings → Indicator Settings → "Template Settings".
- Changes you make to the indicator settings are saved to the template you are using.
Switching Between Chart 1 and Chart 2
On iPhone in landscape, the "Chart1" / "Chart2" button at the bottom right switches charts instantly without reloading. For example, keep a 4-hour chart on Chart 2 to watch for chances, and switch to a 15-minute chart on Chart 1 to time your entry.
On iPad, the button is shown in landscape when a single chart is displayed. With a keyboard, press the Tab key.
Fast-Forward by Long-Pressing the Chart
Set Settings → Chart Operation → "Long press on chart" to "Playback". Long-pressing the chart then keeps moving the chart forward. Combine it with a faster "Speed of forward button" (for example, ×8) to skip ahead until a chance appears, then return to normal playback.
Pause Playback When the Price Touches a Line
Tap the price label of a horizontal line and turn on "Pause" at the left of the menu. Playback stops the moment the price reaches the line. This works once per line. It is useful when you want to play fast until the price leaves a range and then watch slowly.
Keyboard Shortcuts (iPad)
With a hardware keyboard, you can use these keys:
- Return: start / stop playback
- Space: move forward one candlestick
- Z: move back one candlestick
- ↑ / ↓: change the time frame of the active chart one level up / down
- ← / →: scroll the chart left / right
- W / Q: speed up / slow down playback
- Tab: switch between Chart 1 and Chart 2 (single-chart landscape layout)
- B: buy, S: sell, C: close all
- Delete: delete the selected shape
- ⌘S: bookmark the chart image, ⌘C: copy the chart image
The active chart is the chart you last tapped, scrolled or otherwise used.
Using an External Display (iPad)
On iPad models that support extended displays (such as iPad Pro with M1 or later), the app can fill the external display. On other models, the iPad screen is mirrored, with black bars on the sides.